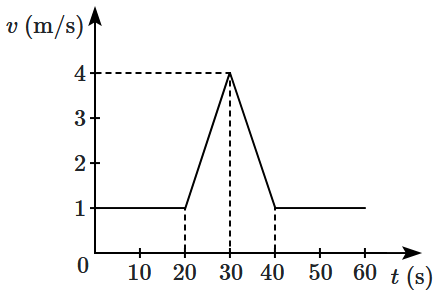
In the following graph, the distance travelled by the body in metres is:


1. \(200\) 2. \(250\)
3. \(300\) 4. \(400\)
Subtopic:  Graphs |
 87%
Level 1: 80%+
To view explanation, please take trial in the course.
NEET 2026 - Target Batch - Vital
Hints
Links
To view explanation, please take trial in the course.
NEET 2026 - Target Batch - Vital

The xt graph shown in figure represents  

1. Constant velocity

2. Velocity of the body is continuously changing

3. Instantaneous velocity

4. The body travels with constant speed upto time t1 and then stops

Subtopic:  Graphs |
 86%
Level 1: 80%+
PMT - 1984
To view explanation, please take trial in the course.
NEET 2026 - Target Batch - Vital
Hints
To view explanation, please take trial in the course.
NEET 2026 - Target Batch - Vital

For the velocity-time graph shown in figure below the distance covered by the body in last two seconds of its motion is what fraction of the total distance covered by it in all the seven seconds 

1. 12

2. 14

3. 13

4. 23

Subtopic:  Graphs |
 80%
Level 1: 80%+
PMT - 1998
To view explanation, please take trial in the course.
NEET 2026 - Target Batch - Vital
Hints
To view explanation, please take trial in the course.
NEET 2026 - Target Batch - Vital

advertisementadvertisement

The velocity-time \((v\text-t)\) graph of a body moving in a straight line is shown in the figure. The displacement and distance travelled by the body in \(6\) s are, respectively: 


1. \(8\) m, \(16\) m
2. \(16\) m, \(8\) m
3. \(16\) m, \(16\) m
4. \(8\) m, \(8\) m

Subtopic:  Graphs |
 80%
Level 1: 80%+
To view explanation, please take trial in the course.
NEET 2026 - Target Batch - Vital
Hints
Links
To view explanation, please take trial in the course.
NEET 2026 - Target Batch - Vital

A lift is going up. The variation in the speed of the lift is as given in the graph. What is the height to which the lift takes the passengers?


1. \(3.6~\text{m}\)
2. \(28.8~\text{m}\)
3. \(36.0~\text{m}\)
4.  It cannot be calculated from the above graph.
Subtopic:  Graphs |
 69%
Level 2: 60%+
To view explanation, please take trial in the course.
NEET 2026 - Target Batch - Vital
Hints
Links
To view explanation, please take trial in the course.
NEET 2026 - Target Batch - Vital

The vt graph of a moving object is given in the figure. The maximum acceleration is:
                             
1.  1cm/sec2
2.  2cm/sec2
3.  3  cm/sec2
4.  6  cm/sec2

Subtopic:  Graphs |
 63%
Level 2: 60%+
To view explanation, please take trial in the course.
NEET 2026 - Target Batch - Vital
Hints
To view explanation, please take trial in the course.
NEET 2026 - Target Batch - Vital

advertisementadvertisement

The displacement versus time graph for a body moving in a straight line is shown in the figure. Which of the following regions represents the motion when no force is acting on the body?

1. ab

2. bc

3. cd

4. de

Subtopic:  Graphs |
 60%
Level 2: 60%+
To view explanation, please take trial in the course.
NEET 2026 - Target Batch - Vital
Hints
To view explanation, please take trial in the course.
NEET 2026 - Target Batch - Vital

Velocity-time curve for a body projected vertically upwards is 

1. Parabola

2. Ellipse

3. Hyperbola

4. Straight line

Subtopic:  Graphs |
 58%
Level 3: 35%-60%
AIIMS - 1999
To view explanation, please take trial in the course.
NEET 2026 - Target Batch - Vital
Hints
To view explanation, please take trial in the course.
NEET 2026 - Target Batch - Vital

Velocity-time \((v\text-t)\) graph for a moving object is shown in the figure. Total displacement of the object during the time interval when there is non-zero acceleration or retardation is:
       
1. \(60~\text{m}\)
2. \(50~\text{m}\)
3. \(30~\text{m}\)
4. \(40~\text{m}\)

Subtopic:  Graphs |
 56%
Level 3: 35%-60%
PMT - 2005
To view explanation, please take trial in the course.
NEET 2026 - Target Batch - Vital
Hints
To view explanation, please take trial in the course.
NEET 2026 - Target Batch - Vital

advertisementadvertisement

The graph between the displacement \(x\) and time \(t\) for a particle moving in a straight line is shown in the figure.


During the interval OA, AB, BC and CD the acceleration of the particle is:

OA AB BC CD
1. + 0 + +
2. 0 + 0
3. + 0 +
4. 0 0

Subtopic:  Graphs |
 51%
Level 3: 35%-60%
PMT - 1986
To view explanation, please take trial in the course.
NEET 2026 - Target Batch - Vital
Hints
Links
To view explanation, please take trial in the course.
NEET 2026 - Target Batch - Vital